MultiCon Sidgets

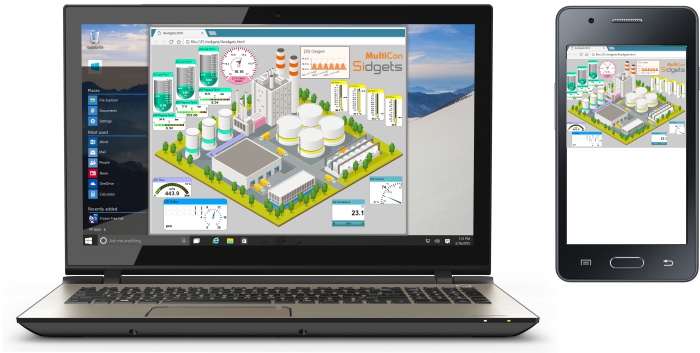
MultiCon Sidgets technology gives the possibility of the easy creation of SCADA visualizations for real-time viewing of measurements provided by MultiCon devices. Each visualization is created by the user in the form of a web page, but in order to create a simple visualization, no programming expertise is required. To create simple visualizations, you only need to read this guide. Additionally, MultiCon Sidgets technology has been developed in such a way that more experienced users can use it as part of a larger IT system, e.g. with visualizations available in the area of user accounts.
As this technology works in accordance with the latest web development standards, such as HTML5+, CSS3+, JS6+, it requires the use of newer versions of web browsers, but the hardware platform or operating system used to display this visualization is irrelevant.
Enabling access to MultiCon devices via the Internet and placing the prepared visualization on a publicly accessible server will additionally allow for surveillance of monitored facilities from any place in the world.
 |
This option is available for devices equipped with firmware version 5.07 or newer. It offers:
- SCADA visualization,
- real-time data preview,
- objects monitoring from any place in the world,
- access to data from any device supporting a web browser,
- compatibility with the latest web standards such as HTML5 +, CSS3 +, JS6 +,
- building websites possibility without the specialized programming knowledge,
- the ability to place the prepared visualization on a public server,
- possibility of integration with a larger, external IT system.
Using Sidgets in 5 steps |
|
Visualisation creation tutorial |
|
 |
Demo visualisation - graphical sidgets |
|
Demo visualisation - text sidgets |
Sidgets - First steps |
|
Exemplary HTML files |
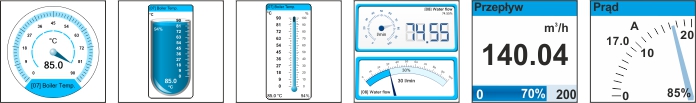
- Text - channel data is presented in the form of freely formatted text, e.g. in an easy to read table.
- Value - channel data is presented in the form of a numerical value and a fill bar scaled by the user.
- Needle - channel data is presented by a needle in a user-defined range.
- Graph - channel data is presented in the form of a graph. This type of sidget allows you to view not only the current sample, but also several previous ones.
- Thermometer - sidget designed with temperature measurements in mind. Channel data is presented as a fill in the thermometer graphic
- Two-state LED - two-color LED. State transition threshold is set by the user.
- Three-state LED - three-color LED. State transition thresholds are set by the user.
- Three-state RectangularLED - rectangular tricolor diode.
- Analog Meter - channel data is presented by means of a circular indicator.
- Horizontal LED Bar - channel data is presented in the form of a horizontal bargraph that is scaled by the user.
- Digital & Analog - a "double" indicator that shows channel data both in a numerical form, and by means of a clock hand.
- Arc LED Bar - channel data is presented in the form of a round bargraph that is scaled by the user.
- Tank - sidget created with level measurement in mind. Channel data is presented as filling in tank graphics.
- Pie Chart - this sidget presents channel data as filling in a pie chart.